App marketing measurement framework
Welcome to the tenth edition of MAMA Boards, an AppsFlyer video project featuring leading mobile marketing experts on camera.
For today’s mini whiteboard master class, we have Oded Onn, Global Head of Digital Marketing at Gett, a global on-demand mobility company that connects customers with transportation, goods and services.
In a data-driven and fragmented mobile ecosystem, it is mission-critical to have a well-designed app marketing measurement framework to collect and make sense of it all. Otherwise, mobile measurement has little value to marketing efforts. For this reason, Oded covers, first, the standard user acquisition funnel and then the core components of creating your own solid app marketing measurement framework, finishing the lesson with tips for getting started with this process in a powerful way.
Real experts, real growth. That’s our motto.
Enjoy!
Transcription
Hi, everybody, welcome to another edition of MAMA Boards by AppsFlyer. My name is Oded Onn and I’m the global head of digital marketing at Gett, one of the leading mobility apps in the world. We are driving over 200 million miles per year with our fleet, and today I want to speak with you about app measurement framework.
This talk is aimed mostly at marketeers that are starting their journey in the world of marketing and measurement, and we’ll go through an interesting framework that I think will be very helpful for you.
So, why measure?
Let’s start with the basics – why measure? I mean, if you’re thinking of overall marketing channels, mobile is one of the most accurate and measurable channels that you have, way more than desktop or other channels, like brand and offline.
Now it’s super data-driven.
You have ton of data, you have user identifiers, you have agents, you have different channels, so clearly a ton of data. Therefore, without a meaningful framework to collect it all and make sense of it, there’s no point in measurement.
That’s what we’re here to talk with you about today.
Channel performance measurement framework
I would love to present you with a very simple yet very efficient framework for looking at your different channels, measure your ROI, and make sense of what you’re spending money on. Let’s jump right in.
There are, of course, multiple channels. We’re all using user acquisition, whether that’s CRM re-engagement or brand campaigns, and we’re also using multiple objectives. Some of you are looking at the number of installs and some of you are looking at other KPIs like engagement or revenue per user, etc. Clearly, there are different channels and different metrics, so how do you make sense of it all?
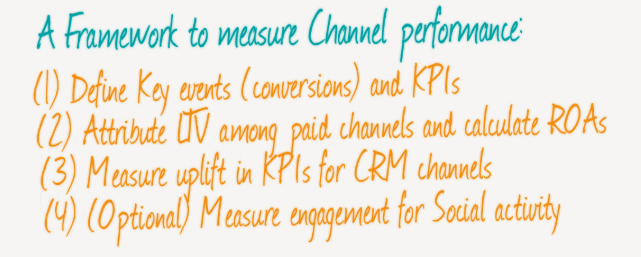
Today, I’m going to look with you at this framework to measure your channel performance. It essentially includes four relatively small steps.
First, we’ll define your key goals and metrics. What are your conversions, or meaningful actions that you want users to complete?
Second, we’ll attribute your LTV among those paid channels, the channels where you actually have direct costs.
Third, we’ll measure uplift in KPIs for the CRM channels, engagement channels, even those channels that don’t have direct costs related to them. You still want to measure what they do, and what’s the uplift.
Fourth, and this one is more optional, we’ll look at measurement engagement for your social activity.
What is the standard conversion funnel currently used by apps?
So let’s look at the traditional conversion funnel for apps.
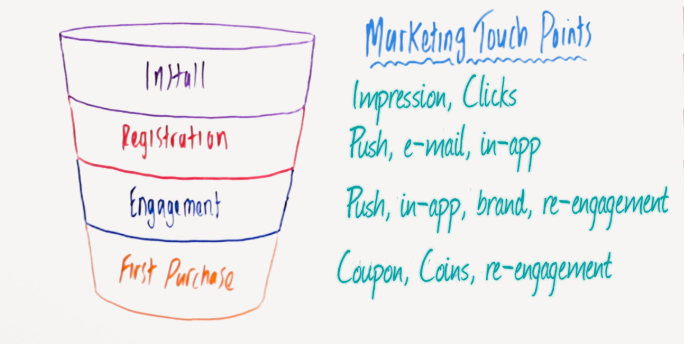
First, we start with the install, then maybe you have a registration or sign up, then some engagement event. For example, a user might have passed the level if it’s a game, or opened the app for a second time.
After that, most apps are looking for the first purchase, or when the user is actually becoming a revenue-generating user.
Clearly, we have multiple touch points along this funnel. There are the impressions and clicks that lead to an install, in addition to the push notifications or emails or in-app messages that drive more users to a sign-up and later on to engagement. When you’re looking at the first purchase, some apps use a coupon and other incentives, like game coins.
No matter which ones you focus on yourself, all of these touch points are looking at driving the user through the usage funnel from the very beginning, the first install and top of the funnel, to the bottom of the funnel and post-install events, like the first purchase.
How do you measure ROAS on paid channels?
So we’ve covered the basic “Why measure?” and the standard funnel; now I would like to take you through the first step in our framework – how we attribute LTV to those paid channels, so let’s jump in to how we measure the ROAS for paid channels.
What do I mean by ROAS? The acronym stands for “return on ad spend.” When you measure the return from channels with direct spend, we call this value ROAS. This is different than the ROI that you usually hear; ROI is a global term, while ROAS is just for performance marketing.
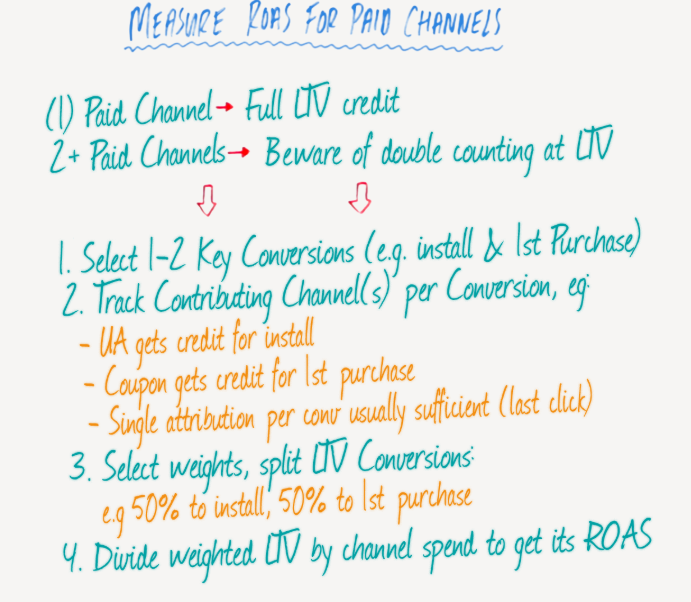
Alright, so how do we measure ROAS? If you have one paid channel, that’s easy. The full lifetime value, or LTV, credit goes to that channel. What do I mean by LTV? I mean the value that a user generates over the course of his lifetime in an app.
For example, in a gaming app, a user has his first purchase, second purchase, etc. All of this revenue they generated, usually multiplied by a margin that you may have, is considered the user lifetime value.
So, if you have one paid channel, all the user LTV gets credited to that channel, but what if you have two or more channels? In that case, you need to be aware of double counting that LTV.
And what do I mean by that? If you have, for example, you’re doing a user acquisition and then you’re giving coupons and maybe another incentive, if you credit each and every of these channels with the full LTV of the users, you will double count, or triple count in some cases, the install. That’s why we have this framework.
So what do you do?
First, as we said, we’ll select one or two key conversions that are meaningful for us. In this case, and it’s very common, we’ll look at the install for our top-of-funnel event, and then first purchase for the post-install event and second conversion.
Second, we’ll measure the contributing channel per each of these conversions that we just defined. If you’re thinking of installs, usually it’s your user acquisition spend that gets the full credit for the installs. Additionally, if you have incentives, coupons, etc., they’ll get the credit for the first purchase.
However, there are many different methodologies of measuring or attributing the conversion. Single attribution is usually sufficient – if you think of user acquisition, you need to understand which was the channel that literally brought the very last click before the install. With a last-touch attribution model, that channel would get the credit for the user.
Third, we’ll select weights and spread the user LTV across the conversion. What do I mean by weights? It’s just percentages. Take a hundred percent of the user lifetime value and split it whatever way makes sense for the business. Let’s take a simple example here: 50% of the credit will go to the install, and then another 50% will go to the first purchase.
Fourth and last, we will divide the weighted LTV – basically the user LTV with respect to those weights that we just selected – by the channel spend, and that will give us the ROAS, the return on ad spend of that channel.
So let’s take a quick example. Let’s assume we have $1,000 spend for user acquisition, for users that made the first purchase with a coupon that overall totaled $500, and also for those users that generated $3,000 of lifetime value for us.
How do we calculate ROAS? If we think of the user acquisition, we take the LTV, the $3,000, multiplied by the weight that we agreed on, 50%, and divide it by the spend of user acquisition, the $1,000 – that will give us 150% ROAS for that particular user acquisition channel.
Then, for the likely high performing coupons, we’ll take the $3,000 LTV multiplied by the same weight we agreed for the first purchase conversion, and divide it by the spend of the coupons, a total of $500, and we’ll get 300%. This is what I talked about for measuring the return on ad spend, the ROAS for the paid channels.
Well, how do I measure the non-paid channels?
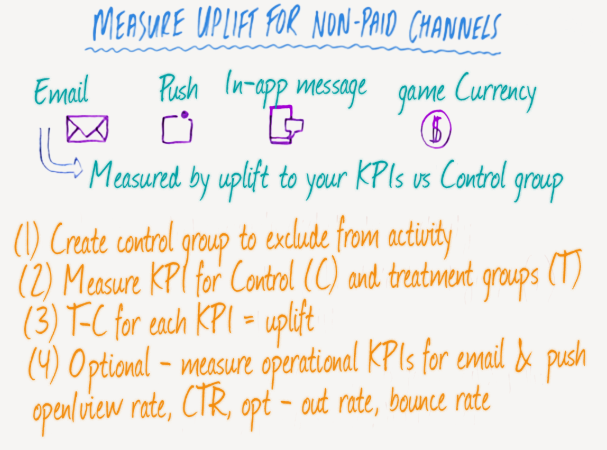
Let’s move on to the second part of the framework, measuring the uplift for the non-paid channels. What are those non-paid channels? Well, those are the CRM channels, and similar to the emails, push notifications, in-app messages, or game currency that you may send.
As long as it doesn’t have direct costs, this type of channel can be considered non-paid. And for those channels, we’ll measure the uplift for a few KPIs that matter most to you.
How do we do that?
First, we’ll create a control group to exclude from the activity. What’s a control group? You might have heard of a hold-out, or control, group, which is basically just a subset of your users to which you do not market. Let’s say 10%, 5% of users you put aside, you don’t market to them, and then you measure how your treatment group performed compared to them.
Why do we do that? Because users perform activities in your app regardless of whether you marketed to them or not. Therefore, by measuring your treatment group of those that you market to vs the control group, you can see the actual uplift of your activity.
So second, we measure the KPI for the control and the treatment groups and then third, we look at the delta, the difference between how the treatment group perform versus the control group. That will give us the uplift for that specific KPI. We can actually do that exercise for multiple KPIs, not just one.
So last, this is an optional thing that you can do for your engagement or CRM activities, such as email and push. For those channels, you can measure operational KPIs – for example, what was the open rate or the view rate, what was the click-through rate, the opt-out rate, bounce rate, etc.
However, those are not crucial for this framework; what we’re looking at, again, is measuring the uplift for the non-paid channels based on the control group and the treatment group.
So let’s look at an example. Let’s assume your KPI is a day seven retention and you want to improve it, right? So, you send a push notification on day six, trying to improve that KPI, and you wait to see what happens.
For the control group, that group that didn’t get the push notification, they had 25% day seven retention. For the treatment group, those you did send a push notification, retention improved to 30%. In absolute numbers, that looks like an uplift of 5%. In actuality, if you think about it, improving from 25% to 30% means 20% improvement, so actually, great performance, which means you should send your push notification. Some cases, by the way, marketing doesn’t work. You may see no increase or you may even see a decline in a KPI – that’s why you measure it against a control group.
To recap guys, we’re looking today at an app marketing measurement framework.
We started with the basic “Why measure?” for all the different data, channels, and marketing touch points we have. Then, we moved to look at how we measure the ROAS, the return on ad spend, for the paid channels. Later, we switched to looking at how you measure uplift for non-paid channels against certain KPIs that matter most.
Tips
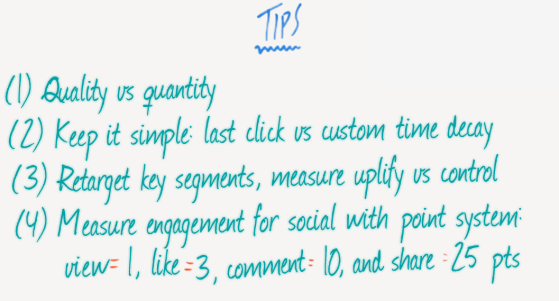
Now let me share with you some tips that hopefully will help you with your measurement framework.
First, emphasize quality over quantity by choosing a few KPIs that make the most sense for you. It really changes by the business. For example, you might be interested in your CPA, your cost per user action, or your ARPU, the average revenue per user, and for other apps, it might be the retention metrics that are what matter most. Either way, be sure to choose a few that are really actionable.
Second, keep it simple. When you start building your framework, you should stick to a last-click attribution model versus a more advanced custom time decay model, or others. Simpler is sometimes easier and actually lets you move forward.
The third tip I want to share with you is to reengage and retarget your key users, your key segments. Maybe you have those high value users that you want to reengage in order to keep them top of mind, and maybe you also have those users that install the app and never convert it. For both groups of users, you will want to approach them with both paid channels and engagement channels like CRM.
How do you measure that activity? Well, it depends. Either way, you will want to measure the uplift versus the control group, and then if it’s a paid channel, you can overlay on top both the spend and the value that was generated.
The last tip is that if you’re doing any social activity, I would recommend you measure the engagement of that activity. How do you do that? Well, one common method in the industry is using a tier system or a point system, which allows you to play with the weight of each event. For example, a view might be worth one point, a like three points, a comment ten points, and a share 25 points.
So why a point system? Essentially, it allows you to measure how much engagement a post on Facebook, for example, generated.
That’s it for today, thank you guys for joining me and watching this MAMA Board.
If you have any questions or comments, please leave them in the section below, and if you want to see other MAMA boards, please visit this link.
Thank you, guys.

